Page Speed Checker
Insira um URL
Verificador de Velocidade de Página
Se uma página demora muito para responder, as pessoas vão embora — e o desempenho nas buscas também pode ser prejudicado. Esta ferramenta gratuita testa uma URL e relata os principais sinais relacionados à velocidade para que você possa identificar páginas lentas rapidamente.
Testar uma Página
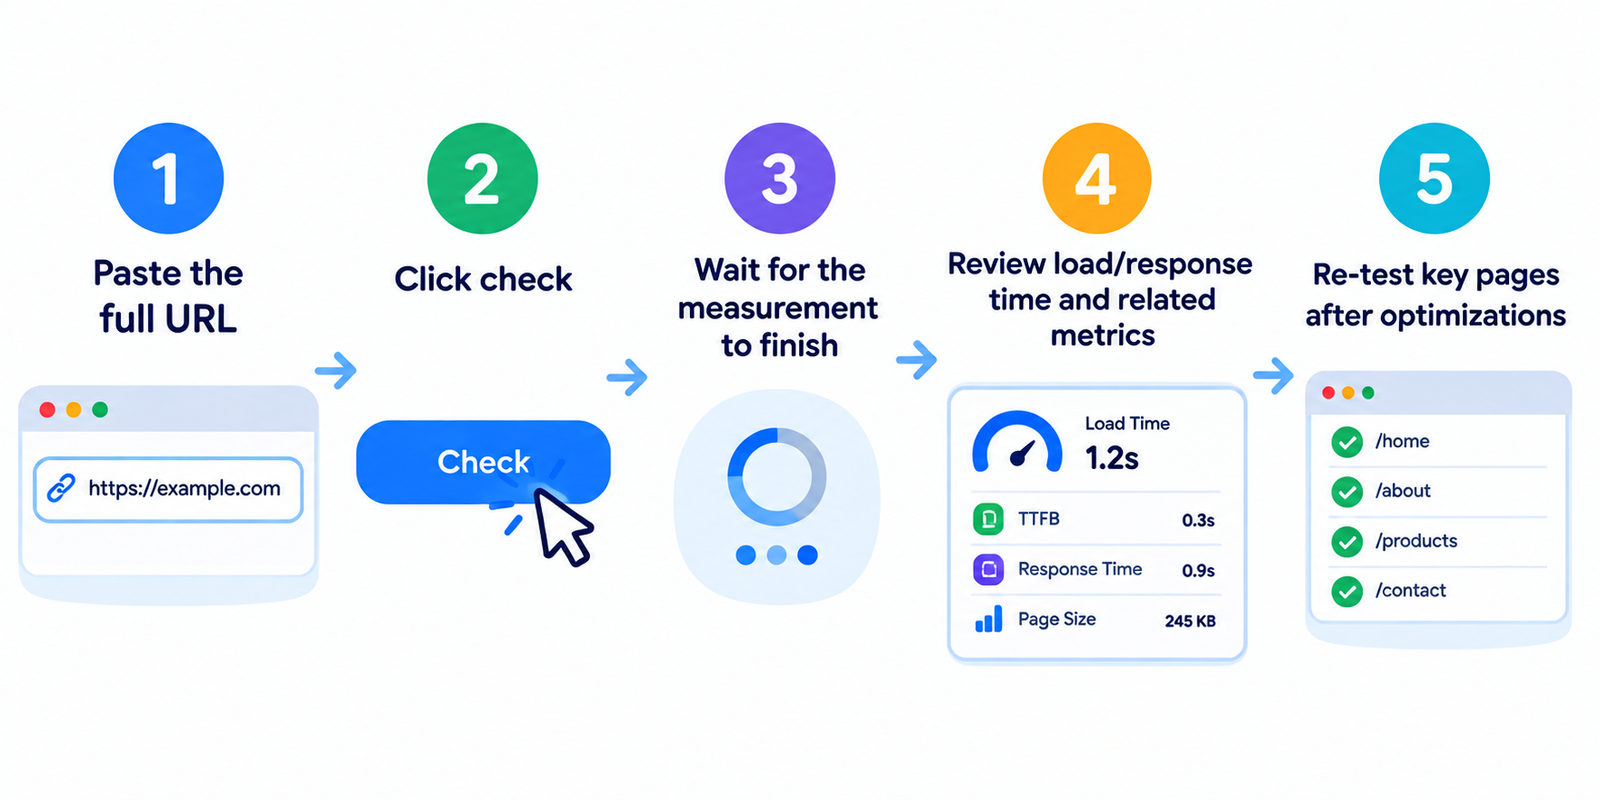
- Cole a URL completa
- Clique em verificar
- Aguarde a medição terminar
- Analise o tempo de carregamento/resposta e as métricas relacionadas
- Teste novamente as páginas principais após as otimizações
Para uma comparação justa, teste as mesmas URLs importantes antes e depois das alterações.
O que a “Velocidade da Página” Geralmente Inclui
A velocidade não é um único número. Uma verificação útil pode analisar:
| Sinal | O que ele indica |
|---|---|
| Tempo de resposta / carregamento | Quanto tempo a requisição leva para retornar |
| Indicadores de peso da página | Se o documento/recursos são pesados |
| Sobrecarga relacionada a requisições | Ativos extras que podem atrasar a renderização |
| Status HTTP | Se a página carrega sem problemas ou se há redirecionamentos/erros |
Algumas ferramentas medem o tempo inicial de busca do HTML.
Outras (como auditorias completas de laboratório) também estimam métricas de renderização e interatividade.
Leia os resultados no contexto do que o seu verificador realmente mede.
Por que a Velocidade Importa
Usuários
Páginas lentas aumentam o risco de rejeição, especialmente em redes móveis.
Conversões
Páginas de produtos, cadastros e finalização de compra são particularmente sensíveis a atrasos.
SEO
O Google usa sinais de experiência de página como parte dos sistemas de classificação. Apenas a velocidade não posicionará um conteúdo fraco, mas um desempenho ruim pode prejudicar boas páginas.
Operações
Quedas repentinas de velocidade podem revelar sobrecarga no servidor, implantações ruins ou scripts pesados de terceiros.
Causas Comuns de Páginas Lentas
- Imagens não otimizadas — arquivos grandes e sem formatos modernos
- Muitos scripts — rastreadores, tags, carrosséis, JS não utilizado
- Resposta lenta do servidor — hospedagem fraca, páginas dinâmicas sem cache
- CSS/JS que bloqueiam a renderização — ativos que atrasam a primeira exibição útil
- Cadeias de redirecionamento — saltos extras antes da página final
- Temas/plugins pesados — especialmente em sites de CMS
- Sem CDN / cache deficiente — cada visita reconstrói o trabalho desnecessariamente
Comece pelos maiores vilões: peso de mídia e scripts de terceiros.
Caminho Prático para Melhorias
- Corrija erros de servidor e redirecionamentos desnecessários primeiro
- Comprima e redimensione as imagens adequadamente
- Ative o cache e, quando útil, uma CDN
- Remova ou adie scripts não críticos
- Minifique o CSS/JS e elimine o código não utilizado
- Teste novamente as mesmas URLs e compare os resultados
- Para uma análise mais profunda, revise também os Core Web Vitals no Search Console / ferramentas de laboratório estilo PageSpeed
Um verificador rápido é ideal para identificar problemas.
Uma auditoria completa é melhor para priorizar correções.
Como Ler os Resultados Sem Exagerar
- Um único teste lento pode ser uma variação temporária de rede — verifique novamente
- A velocidade da página inicial ≠ a velocidade da página de produto — teste o que importa comercialmente
- Resultados com e sem cache podem diferir bastante
- Uma “resposta HTML rápida” é boa, mas os usuários ainda precisam de uma renderização rápida
- Busque melhorias consistentes, não uma pontuação única perfeita
Compare seus principais modelos (página inicial, categoria, artigo, produto) em vez de apenas URLs aleatórias.
FAQ
Este Verificador de Velocidade de Página é gratuito?
Sim. Os testes padrão não exigem uma conta.
Isso é o mesmo que o Google PageSpeed Insights?
Não necessariamente. Esta ferramenta oferece uma verificação rápida de desempenho. As ferramentas do Google também relatam métricas de laboratório/campo e sugestões detalhadas de otimização.
Por que a página fica lenta apenas às vezes?
A carga do servidor, os atrasos de scripts de terceiros e as condições de rede podem variar de acordo com o horário e a localização.
Apenas a velocidade pode posicionar meu site mais alto?
Não. A velocidade promove uma melhor experiência e pode ajudar no SEO, mas a relevância e a qualidade do conteúdo continuam essenciais.
Devo testar dispositivos móveis e computadores separadamente?
Sim, sempre que possível. As limitações dos dispositivos móveis geralmente expõem problemas de desempenho primeiro.
Ferramentas relacionadas
- Page Size Checker
- Server Status Checker
- Webpage Screen Resolution Simulator
- Get Source Code of Webpage
- Domain Hosting Checker
Nota: Os números de desempenho podem variar de acordo com a localização do servidor, o cache e as condições da rede. Use testes repetidos e várias URLs principais para obter um panorama mais confiável.