Page Speed Checker
Introduce una URL
Comprobador de Velocidad de Página
Si una página tarda demasiado en responder, los usuarios se van y el rendimiento de búsqueda también puede verse afectado. Esta herramienta gratuita prueba una URL e informa sobre señales clave relacionadas con la velocidad para que puedas detectar páginas lentas rápidamente.
Probar una Página
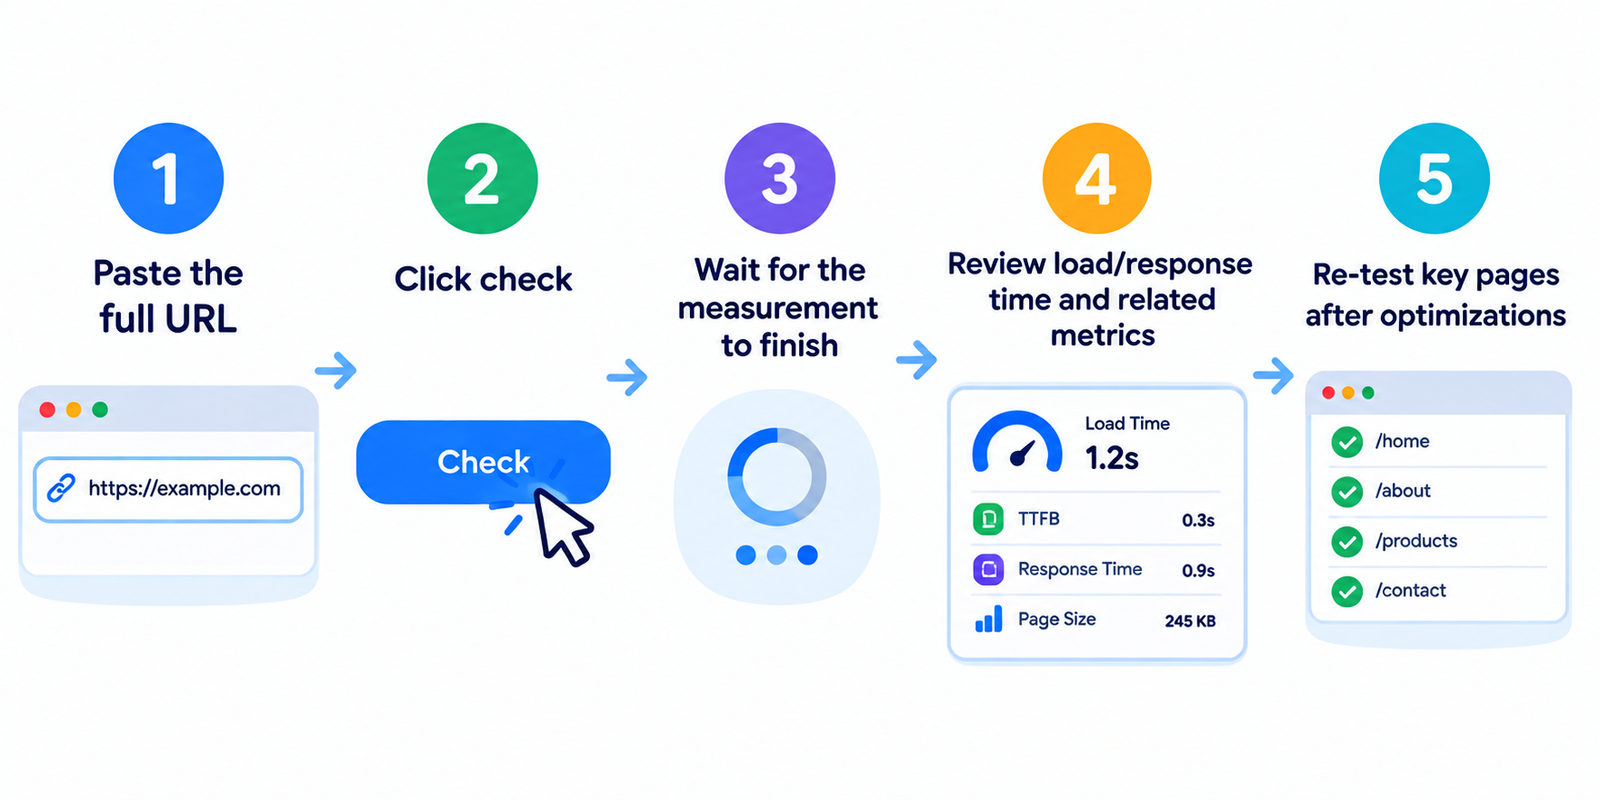
- Pega la URL completa
- Haz clic en comprobar
- Espera a que finalice la medición
- Revisa el tiempo de carga/respuesta y las métricas relacionadas
- Vuelve a probar las páginas clave después de realizar optimizaciones
Para una comparación justa, prueba las mismas URLs importantes antes y después de los cambios.
Qué suele incluir la “Velocidad de Página”
La velocidad no es un único número. Una comprobación útil puede examinar:
| Señal | Lo que te indica |
|---|---|
| Tiempo de respuesta / carga | El tiempo que tarda la solicitud en devolver una respuesta |
| Indicadores de peso de página | Si el documento o los recursos son pesados |
| Sobrecarga relacionada con solicitudes | Recursos adicionales que pueden ralentizar el renderizado |
| Estado HTTP | Si la página carga limpiamente o presenta redirecciones/errores |
Algunas herramientas miden el tiempo de obtención del HTML inicial.
Otras (como las auditorías de laboratorio completas) también estiman las métricas de renderizado e interacción.
Lee los resultados en el contexto de lo que tu comprobador mide realmente.
Por qué importa la velocidad
Usuarios
Las páginas lentas aumentan el riesgo de rebote, especialmente en redes móviles.
Conversiones
Las páginas de productos, registros y pago son especialmente sensibles a los retrasos.
SEO
Google utiliza las señales de experiencia de página como parte de sus sistemas de clasificación. La velocidad por sí sola no posicionará un contenido pobre, pero un rendimiento deficiente puede frenar a las buenas páginas.
Operaciones
Las ralentizaciones repentinas pueden revelar problemas de alojamiento, implementaciones incorrectas o scripts pesados de terceros.
Causas comunes de las páginas lentas
- Imágenes no optimizadas — archivos demasiado grandes y sin formatos modernos
- Demasiados scripts — rastreadores, etiquetas, carruseles, JS no utilizado
- Respuesta lenta del servidor — alojamiento deficiente, páginas dinámicas sin caché
- CSS/JS que bloquea el renderizado — recursos que retrasan el primer meaningful paint (primer despliegue con contenido significativo)
- Cadenas de redirección — saltos adicionales antes de llegar a la página final
- Temas/plugins pesados — especialmente en sitios CMS
- Sin CDN / caché deficiente — cada visita procesa el trabajo nuevamente de forma innecesaria
Empieza por los mayores infractores: el peso multimedia y los scripts de terceros.
Ruta de mejora práctica
- Soluciona primero los errores del servidor y las redirecciones innecesarias
- Comprime y ajusta el tamaño de las imágenes adecuadamente
- Habilita la caché y, cuando sea útil, una CDN
- Elimina o aplaza los scripts no críticos
- Minifica el CSS/JS y elimina el código no utilizado
- Vuelve a probar las mismas URLs y compara los resultados
- Para un análisis más profundo, revisa también las Core Web Vitals en Search Console / herramientas de laboratorio tipo PageSpeed
Un comprobador rápido es ideal para detectar problemas.
Una auditoría completa es mejor para priorizar correcciones.
Cómo leer los resultados sin reaccionar de más
- Una prueba lenta puede ser una variación temporal de la red — vuelve a comprobarlo
- La velocidad de la página de inicio ≠ la velocidad de la página de producto — prueba lo que importa comercialmente
- Los resultados con caché frente a los sin caché pueden diferir mucho
- Una “respuesta HTML rápida” es buena, pero los usuarios aún necesitan un renderizado rápido
- Apunta a una mejora constante, no a una puntuación única perfecta
Compara tus plantillas clave (inicio, categoría, artículo, producto) en lugar de limitarte a URLs aleatorias.
Preguntas frecuentes
¿Este comprobador de velocidad de página es gratuito?
Sí. Las pruebas estándar no requieren una cuenta.
¿Es esto lo mismo que Google PageSpeed Insights?
No necesariamente. Esta herramienta ofrece una comprobación rápida de rendimiento. Las herramientas de Google también informan sobre métricas de laboratorio/campo y sugerencias detalladas de optimización.
¿Por qué la página es lenta solo a veces?
La carga del alojamiento, los retrasos de scripts de terceros y las condiciones de la red pueden variar según la hora y la ubicación.
¿Puede la velocidad por sí sola posicionar mi sitio más alto?
No. La velocidad fomenta una mejor experiencia y puede ayudar al SEO, pero la relevancia y la calidad del contenido siguen siendo esenciales.
¿Debo probar el móvil y el escritorio por separado?
Sí, siempre que sea posible. Las limitaciones móviles suelen dejar al descubierto los problemas de rendimiento primero.
Herramientas relacionadas
- Comprobador de Tamaño de Página
- Comprobador de Estado del Servidor
- Simulador de Resolución de Pantalla para Páginas Web
- Obtener Código Fuente de Página Web
- Comprobador de Dominio y Alojamiento
Nota: Los números de rendimiento pueden variar según la ubicación del servidor, la caché y las condiciones de la red. Utiliza pruebas repetidas y varias URLs clave para obtener una imagen más confiable.