Google Pagespeed Insights Checker | Bingo Web Rabbit

Pagespeed Insights Checker


Inserisci un URL


Captcha

Google PageSpeed Insights Checker

If your website feels sluggish but you're not sure why, you need data—not guesses. Our Google PageSpeed Insights Checker connects you directly to Google's own testing tool, pulling back performance scores, Core Web Vitals, and a prioritized list of fixes for every URL you submit.

Enter one or more URLs, one per line, up to 20 at a time. We'll run each through Google's PageSpeed Insights API and bring back the results: mobile and desktop scores, real user data where available, and actionable recommendations. No accounts, no hidden limits.

What Is Google PageSpeed Insights?

PageSpeed Insights (PSI) is Google's free tool for measuring how well a webpage performs—from the perspective of both synthetic lab tests and real-world Chrome user data. The tool uses Lighthouse (an open‑source, automated audit tool) to evaluate performance, accessibility, best practices, and SEO.

The output is organized into:

  • Performance Score (0–100) – A composite score based on multiple performance metrics; higher is better.
  • Core Web Vitals Assessment – Pass/Fail based on real‑world user data (First Contentful Paint, Largest Contentful Paint, Cumulative Layout Shift).
  • Field Data – Actual performance metrics collected from Chrome users who visited your page (origin summary data is included when available).
  • Lab Data – Simulated performance tests run in a controlled environment to highlight specific bottlenecks.
  • Diagnostic Information – Metrics like Time to Interactive, Speed Index, and Total Blocking Time.
  • Opportunities & Diagnostics – A prioritized, itemized list of suggestions for speeding up the page, with documentation links and estimated savings.

Google uses page speed as a ranking signal, so a poor PSI result can directly impact your search visibility.

How the Tool Works

We use the official PageSpeed Insights API v5. No web scraping, no third‑party approximation. Your results come straight from Google.

For each URL you submit:

  1. We send a request to https://www.googleapis.com/pagespeedonline/v5/runPagespeed?url=YOUR_URL.
  2. The API returns a JSON payload containing Lighthouse results, Core Web Vitals, and optimization suggestions.
  3. We parse the JSON to extract the most useful information, organize it by mobile and desktop, and present it as clean text.

The API works without authentication for low volumes. No API key is required for normal use, making bulk checks effortless.

How to Use the Checker

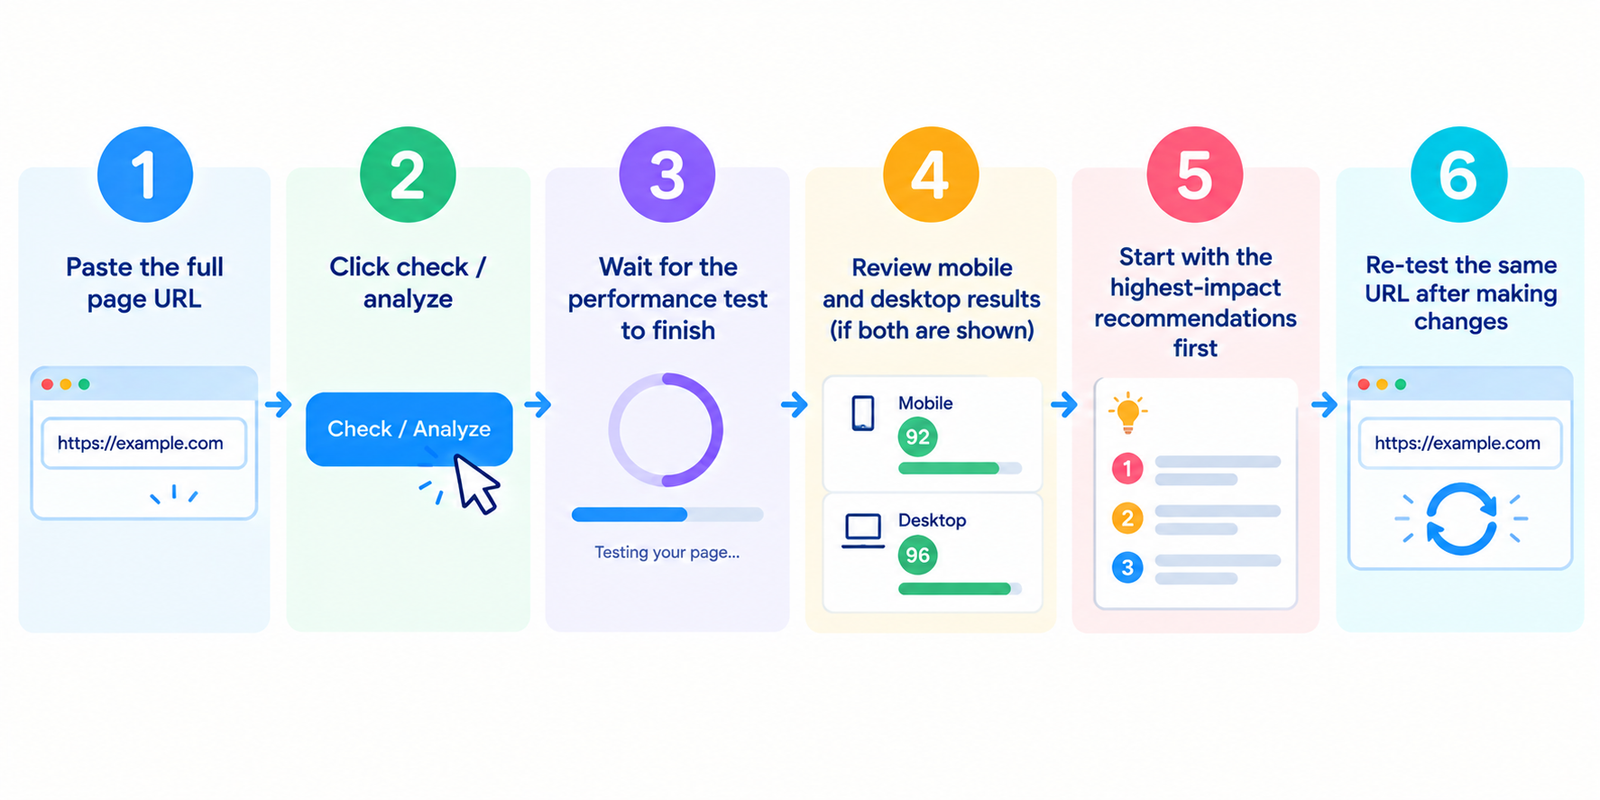
Step 1 – Gather your URLs.
These can be any web‑accessible URL: a homepage, a blog post, a product category, or an entire page.

https://bingowebrabbit.com
https://bingowebrabbit.com/page-speed-checker
https://bingowebrabbit.com/dns-lookup

Step 2 – Paste them into the tool.
One URL per line, up to 20 at once.

Step 3 – Click “Run PageSpeed Tests”.
Each URL takes about 15–30 seconds. The tool waits for Google to return results, so for multiple URLs you can step away and come back.

Step 4 – Review the output.
Results are grouped by URL and device type (mobile / desktop). For each URL you'll see:

--- URL: https://bingowebrabbit.com ---

MOBILE Performance Score: 72 / 100 (Needs Improvement)

Core Web Vitals Assessment: PASS

Real User Metrics (Field Data from Chrome):
- Largest Contentful Paint: 2.1s (Good)
- First Input Delay: 45ms (Good)
- Cumulative Layout Shift: 0.05 (Good)

Lab Metrics:
- First Contentful Paint: 1.8s
- Time to Interactive: 3.2s
- Speed Index: 2.4s
- Total Blocking Time: 210ms

Top Recommendations (Mobile):
- Remove unused JavaScript
- Reduce server response times (TTFB)
- Properly size images

--- End of Mobile ---

DESKTOP Performance Score: 94 / 100 (Good)

Lab Metrics:
- First Contentful Paint: 0.9s
- Largest Contentful Paint: 1.4s
- Cumulative Layout Shift: 0.02

No critical recommendations.

--- End of Desktop ---

Step 5 – Copy or save the results.
The plain text output is designed to be copied into a spreadsheet, a client report, or your own documentation.

Understanding the Scores

Google has defined clear score ranges and thresholds:

Score Range Color Meaning
90–100 ? Green Good. The page is highly optimized.
50–89 ? Yellow Needs improvement. Acceptable but room to grow.
0–49 ? Red Poor. Urgent fixes required.

In 2026, Google continues to emphasise real‑world user data over synthetic lab scores. Passing the Core Web Vitals assessment for real users is more valuable than achieving a perfect 100 in the lab.

Desktop vs. Mobile Scores – You will almost always see lower mobile scores. Google simulates a slower network connection (typically throttled to emulate 4G) and less processing power on mobile tests. A desktop score of 90 and a mobile score of 65 is quite normal; focus on improving the mobile score first, as mobile‑first indexing means Google primarily sees your site through a mobile lens.

What the Metrics Mean

Largest Contentful Paint (LCP) – Measures loading performance: the time it takes for the largest visible element (hero image, headline, video) to render.
✅ Good: ≤ 2.5 seconds
⚠️ Needs improvement: 2.5–4 seconds
? Poor: > 4 seconds

First Input Delay (FID) – Measures interactivity: how quickly the page responds to the first user click or tap.
✅ Good: ≤ 100 milliseconds
⚠️ Needs improvement: 100–300 milliseconds
? Poor: > 300 milliseconds

Cumulative Layout Shift (CLS) – Measures visual stability: how much unexpected movement occurs during page load.
✅ Good: ≤ 0.1
⚠️ Needs improvement: 0.1–0.25
? Poor: > 0.25

Time to First Byte (TTFB) – How quickly the server responds to the initial request. Aim for < 800 ms.

Total Blocking Time (TBT) – Measures the total time the main thread is blocked from responding to user input. Aim for < 300 ms.

Speed Index – Measures how quickly visible content is painted. Lower is better; aim for < 3.4 seconds.

Real Scenarios

You’re an e‑commerce owner.
Your product pages take over 4 seconds to load. You run the checker; Google reports LCP at 5.2 seconds (Poor). The recommendations point to oversized hero images. You compress the images, implement lazy loading, and run the checker again. LCP drops to 2.1 seconds. Conversions increase.

You’re an SEO agency.
A client insists their site is fast. You run 10 key pages through the bulk checker. Mobile scores range from 34 to 67. You export the results and present them at the next meeting. The client finally approves a performance budget.

You’re a blogger.
Your traffic dropped after a Google update. You suspect speed issues. Run your three most‑visited posts through the tool. Each has red‑zone mobile scores. The recommendations point to a bloated theme and an excessive number of external scripts. You switch to a lightweight theme, combine and minify scripts, and watch the scores climb to yellow then green.

Frequently Asked Questions

What’s the difference between Field Data and Lab Data?
Field Data comes from real Chrome users who visited your page; it’s actual data, not a simulation. The Chrome User Experience Report (CrUX) collects this information at the origin (domain) level and, if available, at the individual URL level. Lab Data runs in a simulated environment (Lighthouse) on Google’s servers, using defined network and device parameters. Passing the field‑data Core Web Vitals assessment is the more important outcome for SEO because it reflects real visitor experiences.

Why do my mobile and desktop scores look so different?
Mobile tests run on a throttled network (slower bandwidth + higher latency) and a less powerful simulated processor. Desktop tests use a fast broadband connection and more processing power. Lower mobile scores are expected; focus your optimisation efforts there first.

What’s a “good” PageSpeed score?
A score of 90+ on both mobile and desktop is excellent. Many high‑traffic sites live in the 50–89 range and still rank well. The bar to clear for a “good page experience” signal in Google Search is passing the real‑user Core Web Vitals assessment, not hitting a perfect lab score.

How many URLs can I check at once?
Up to 20 URLs per batch. For larger lists, run multiple batches. If you need to check hundreds of URLs regularly, contact us about API access.

Is the tool free?
Yes. For normal usage—testing a few hundred URLs per day—the tool is free. Heavy commercial use may require API keys or rate limit adjustments.

What should I do first after getting a poor score?
Read the “Opportunities” section in the results. It lists specific, actionable items with estimated savings. Start with the highest‑impact items: oversized images, render‑blocking resources, and slow server response times.

Can I test pages behind a login?
No, the API cannot authenticate. You must test publicly accessible pages. For staging environments, make them publicly visible or use Lighthouse locally.

Why Use a Bulk Checker?

Manually testing one URL in the PageSpeed Insights web interface is easy. But real‑world optimisation involves testing many pages, many times.

  • After a site‑wide change – Switched hosting providers? Updated your CDN settings? Run a bulk check on 20 key pages before and after.
  • Competitor analysis – Want to see if your main competitor is faster than you? Run both sites in the same batch and compare.
  • Client reporting – Export bulk results to show month‑over‑month improvement across an entire site.
  • Pre‑launch verification – New site ready to go live? Test every template type (homepage, category, product, blog post) in one batch.

Limitations

The tool is a wrapper around Google’s official API. It inherits Google's rate limits and data availability:

  • If a URL has insufficient real‑user traffic, the Field Data section will be missing (CrUX requires a minimum number of visits).
  • Google may occasionally return incomplete or delayed responses. In those cases, our tool will indicate the failure and suggest retrying later.
  • The API can return up to ~600KB of JSON per test. Very large pages with complex screenshots may take longer to process.

Final Word

Page speed is not a vanity metric. It affects bounce rates, conversion rates, and search rankings. But you can't fix what you don't measure.

Our Google PageSpeed Insights Checker gives you the measurements direct from Google, for mobile and desktop, up to 20 URLs at a time. Use it to identify slow pages, track improvements, and demonstrate progress.