Pagespeed Insights Checker
Введите URL

PageSpeed Insights Checker
Страница может выглядеть отлично, но при этом работать медленно.
Этот бесплатный инструмент проверки помогает протестировать показатели производительности URL — включая результаты в виде оценок и ключевые метрики загрузки — чтобы вы могли найти то, что замедляет работу сайта.
Как им пользоваться
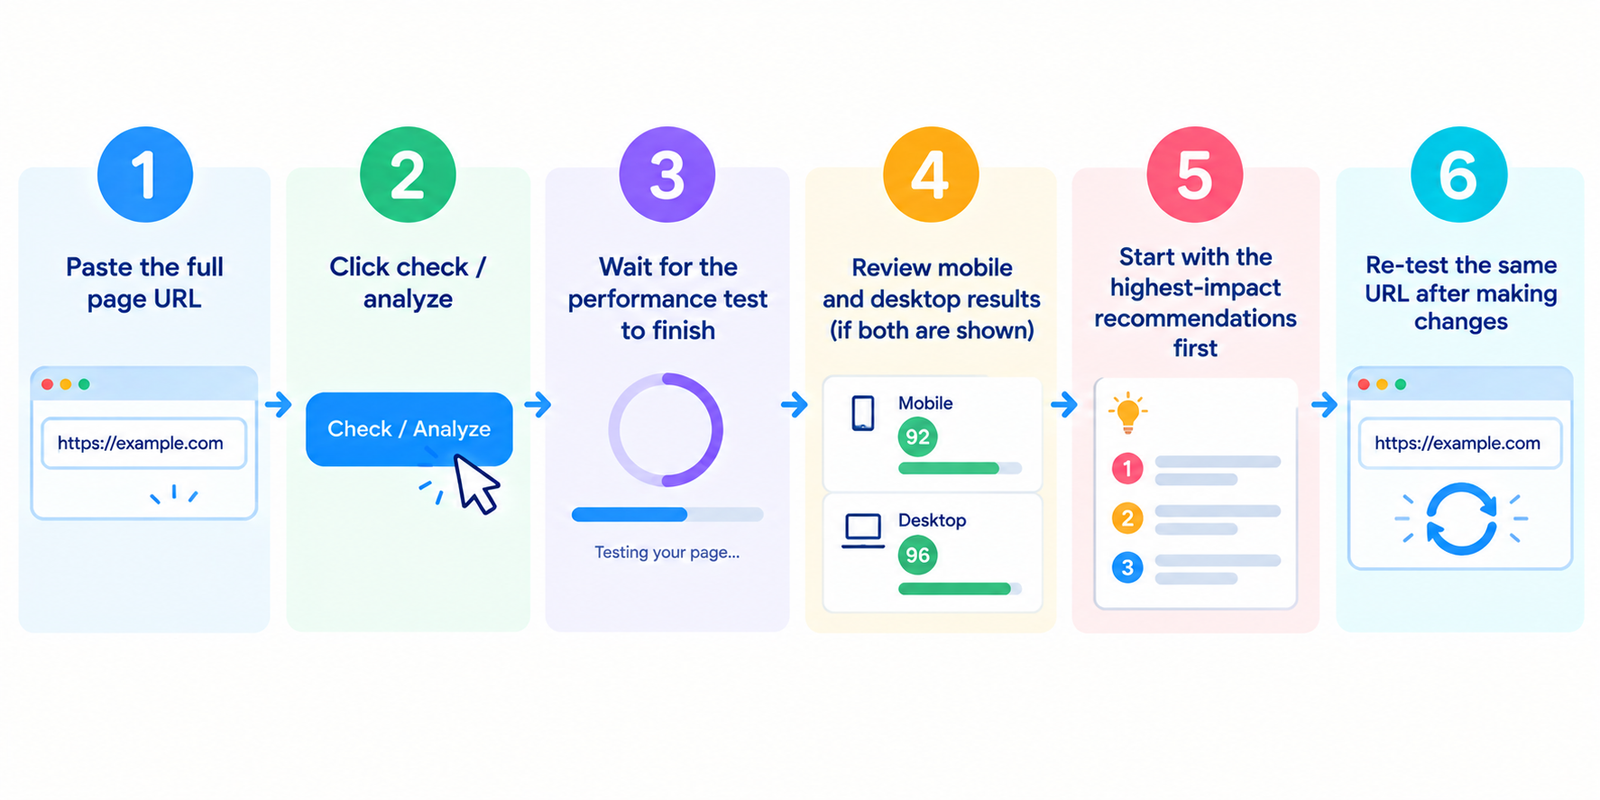
- Вставьте полный URL страницы
- Нажмите «Проверить» / «Анализировать»
- Дождитесь завершения тестирования производительности
- Изучите результаты для мобильных устройств и ПК (если отображаются оба варианта)
- Начните с рекомендаций, имеющих наибольшее влияние
- Повторно протестируйте тот же URL после внесения изменений
Для получения надежных результатов тестируйте важные шаблоны страниц: главную, категории, товары и статьи.
Что обычно включает в себя такой отчет
| Раздел | Что он помогает понять |
|---|---|
| Оценка производительности | Общий лабораторный рейтинг скорости (обычно от 0–100) |
| Сигналы Core Web Vitals | Метрики загрузки, интерактивности и стабильности, ориентированные на пользовательский опыт |
| Лабораторные данные | Результаты контролируемых тестов в смоделированных условиях |
| Полевые данные (при наличии) | Данные о реальном пользовательском опыте от пользователей Chrome |
| Возможности оптимизации | Конкретные исправления, которые могут повысить скорость |
Полевые данные доступны не всегда для URL с низким трафиком. В таких случаях больше полагайтесь на лабораторные результаты и повторное тестирование.
Основные метрики для отслеживания
LCP (Largest Contentful Paint — наибольшая отрисовка контента)
Как быстро появляется основной видимый контент.
INP (Interaction to Next Paint — задержка ввода до следующего кадра)
Насколько отзывчивой кажется страница после взаимодействия пользователя.
(В старых отчетах все еще может упоминаться FID; INP — это современная метрика интерактивности.)
CLS (Cumulative Layout Shift — совокупное смещение макета)
Насколько сильно макет неожиданно смещается во время загрузки.
Вспомогательные лабораторные метрики часто включают First Contentful Paint (FCP), Speed Index, Total Blocking Time (TBT) и индикаторы ответа сервера.
Стремитесь улучшить реальный пользовательский опыт, а не просто гнаться за идеальной оценкой.
Как читать оценки без лишней паники
- 90+ обычно указывает на высокую производительность в лабораторных условиях
- 50–89 означает, что есть пространство для улучшений
- Ниже 50 обычно требует первоочередного устранения проблем
Оценки для мобильных устройств часто ниже, чем для ПК, так как мобильные тесты используют более строгие условия сети и устройств.
Это нормально. По возможности оптимизируйте мобильную версию в первую очередь.
Также помните: результаты одного теста могут варьироваться. Перепроверяйте сайт после внесения изменений и сравнивайте одни и те же URL с течением времени.
Частые проблемы, стоящие за низкими результатами
- Слишком большие или неоптимизированные изображения
- Блокирующие рендеринг CSS/JavaScript файлы
- Медленный ответ сервера / слабый хостинг
- Слишком много сторонних скриптов
- Смещение макета из-за рекламы, встроенных элементов или долго загружающихся объектов
- Тяжелые темы, конструкторы страниц или неиспользуемый код
- Отсутствие кэширования или неэффективная доставка контента
Большинство сайтов быстрее всего улучшаются за счет оптимизации медиафайлов, удаления лишних скриптов и ускорения ответа сервера.
Практический порядок оптимизации
- Исправьте критические ошибки и основные перенаправления
- Сотрите и правильно масштабируйте изображения
- Улучшите ответ сервера (настройте кэширование/CDN/хостинг, где это необходимо)
- Отложите загрузку или удалите второстепенные скрипты
- Уменьшите смещение макета (задайте размеры, стабилизируйте поздно загружающийся контент)
- Повторно протестируйте и измерьте результат
- Переходите к более тонкой оптимизации только после достижения значительных успехов
Небольшое число высокоэффективных исправлений обычно приносит больше пользы, чем десятки мелких правок.
Часто задаваемые вопросы
Бесплатен ли этот инструмент PageSpeed Insights Checker?
Да. Стандартные проверки не требуют создания аккаунта.
Равна ли эта оценка показателю ранжирования в Google?
Нет. Производительность влияет на пользовательский опыт и может влиять на сигналы удобства страницы, но ранжирование зависит от множества факторов.
Почему мобильная версия оценивается намного ниже десктопной?
Мобильные тесты обычно более жесткие. Сосредоточьтесь на улучшениях для мобильных устройств в первую очередь.
Почему отсутствуют полевые данные?
Для данного URL или источника может быть недостаточно данных о реальных пользователях Chrome.
Стоит ли стремиться к 100/100?
Это полезно, но не обязательно. Преодоление порогов реального пользовательского опыта и устранение серьезных узких мест важнее перфекционизма.
Связанные инструменты
- Page Speed Checker
- Page Size Checker
- Server Status Checker
- Code to Text Ratio Checker
- Webpage Screen Resolution Simulator
Примечание: результаты производительности могут варьироваться в зависимости от условий тестирования, кэширования и сетевых факторов. Используйте повторные тесты на ключевых URL для более надежного процесса улучшений.